
EnergyConceptual Specification

Knowing Where Every Watt Goes

Comprehensive electrical telemetry architectures capturing voltage, current, power factor, and harmonics across every stage of the data center power delivery chain.

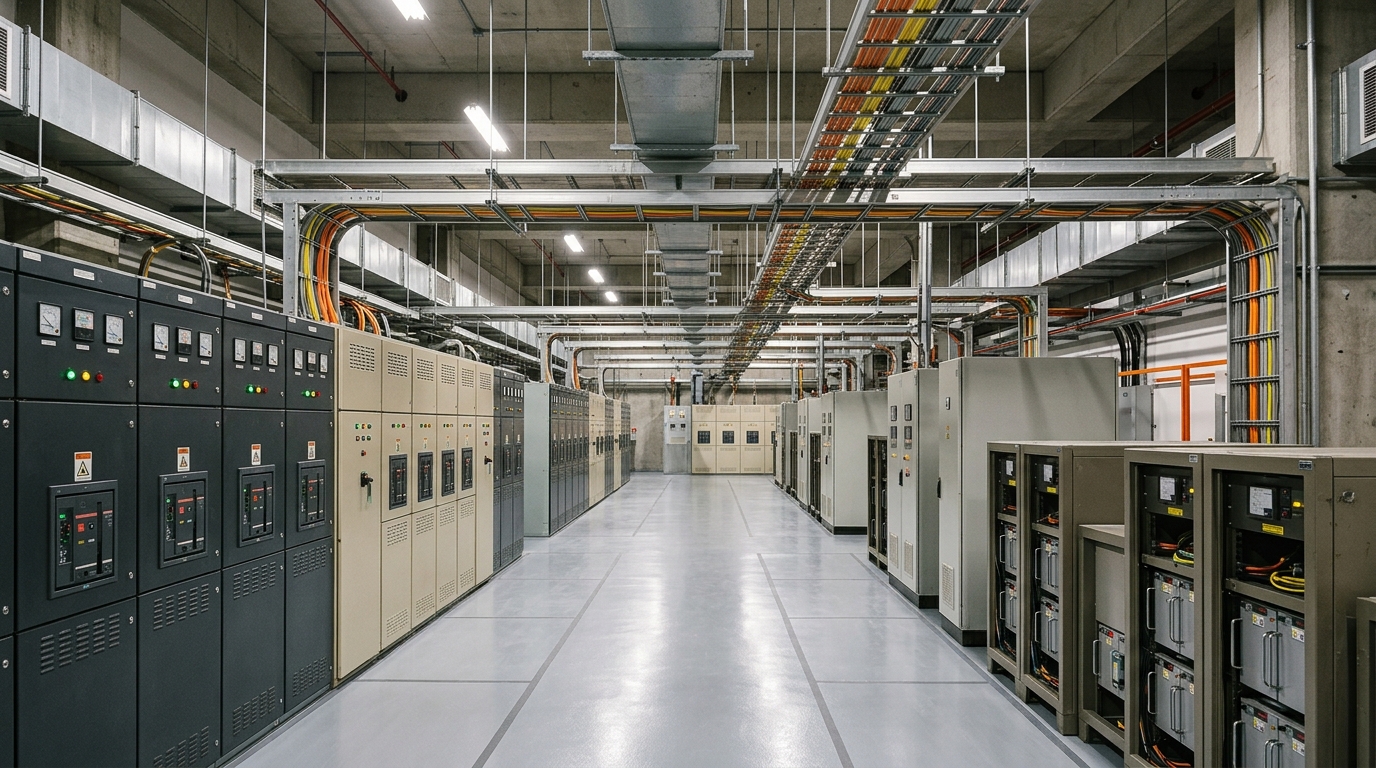
Industrial data center electrical power distribution room with switchgear and busways
ELECTRICAL POWER DISTRIBUTION & UPS INFRASTRUCTURE (ILLUSTRATIVE)POWER INFRASTRUCTURE
01 //

Granular Monitoring Tiers

Legacy data centers may rely on monthly utility bills or coarse facility-level meters, limiting visibility into internal inefficiencies, phase imbalances, and localized stranded capacity. For high-density AI planning, a reference telemetry approach can capture data at multiple physical tiers.

GreenNext specifies a four-tier electrical monitoring hierarchy connecting utility interconnects to individual server components:

TIER 01 · UTILITY & SUBSTATION

Facility-Level Monitoring

High-voltage (110kV/33kV) utility incomers, step-down transformers, automatic transfer switches (ATS), and emergency diesel/gas generators.

TIER 02 · UPS & SWITCHGEAR

Central Distribution & Conditioning

2N modular UPS systems, battery energy storage systems (BESS), active power conditioning, and primary medium-voltage distribution switchboards.

TIER 03 · BUSWAYS & ROWS

Row & Zone Distribution

Overhead smart track busways and power distribution units (PDUs) monitoring branch circuits, three-phase load balance, and neutral currents.

TIER 04 · RACKS & ACCELERATORS

Rack & System Telemetry

Reference rack telemetry using outlet-level switching and server Baseboard Management Controllers (BMCs) to expose CPU, GPU, and memory rail consumption when supported by deployed equipment.

02 //

Operational Value of Continuous Monitoring

An illustrative high-frequency power telemetry approach can help operators identify stranded capacity—power reserved during provisioning that is never actually consumed—and investigate opportunities for safer rack-density planning. Power factor (PF) and total harmonic distortion (THD) measurements can also support investigation of transformer heating and capacitor-bank stress.

Next Step in Lifecycle

Continue Exploring Energy

Examine Thermal & Cooling Systems →
Start a Conversation

Build the Next Generation of Digital Infrastructure

If you are involved in infrastructure planning, data center operations, AI workload management, or regional digital development across South India, we want to understand your requirements.

KPI 01 · ISO/IEC 30134-2 · ILLUSTRATIVE MODEL

Illustrative Power Usage Effectiveness (PUE) Calculator

PUE expresses the relationship between total facility energy and energy delivered to productive IT compute equipment. This local calculator uses user-supplied planning values; it is not a live facility measurement.

Units:

Enter facility and IT values in the same unit and for the same measurement period. The selector changes the displayed unit label only; it does not convert kW, kWh, or MWh values.

Governing EquationPUE = Total Facility Energy ÷ IT Equipment Energy
Thermodynamic Ideal:1.000
Includes IT + cooling + power delivery + lighting
Servers, GPUs, storage arrays, and network switches
Calculated PUE ResultEfficient Modern
1.250ratio
IT Compute Energy Share:80.0%
Auxiliary Facility Overhead:20.0% (25.0% of IT)
Facility Overhead per 100 kW IT:25.0 kW
Interpretation: For every 1.00 kWh of electrical energy delivered to compute silicon, the facility consumes an additional 0.250 kWh in cooling, power conditioning, and auxiliary support.
Measurement Boundary Notice

ISO/IEC 30134-2 defines PUE using a documented measurement boundary and matching measurement period; its public preview describes categories and continuous 12-month reporting. These simplified boundary choices are illustrative and do not establish ISO compliance or certification. PUE alone does not account for water efficiency (WUE) or compute productivity.

Electrical Distribution & Telemetry• Single-Line Topology

Four-Level Power Telemetry & Distribution Hierarchy

Trace electrical flow from high-voltage substation feeds through 2N transformers, overhead track busways, and intelligent rack PDUs with clear PUE boundary instrumentation.

Active Architectural Inspection

Facility-level monitoring

PLANNING REFERENCE

Establish the electrical boundary for whole-facility energy reconciliation and utility intertie.

Incomer Class0.2s Utility Revenue
Feed Voltage33kV / 110kV Dual
BoundaryTotal Facility Power (P_total)
Substation & Facility Metering
  • Utility 110kV / 33kV incoming feed revenue meters (Class 0.2s accuracy)
  • Main vacuum circuit breaker telemetry and power quality analyzers
  • Whole-facility active, reactive, and apparent power logging
Metering accuracy standard: Revenue Class 0.2s at facility intertie, Class 1.0 at rack PDUs.
PUE = P_Total(Facility) / P_IT(Rack Level)