
Automation

Consistent, Structured Visibility Into Infrastructure Operations

Automated operational dashboards, SLA performance verifications, and compliance reporting streams providing clarity to engineering, executive, and regulatory stakeholders.

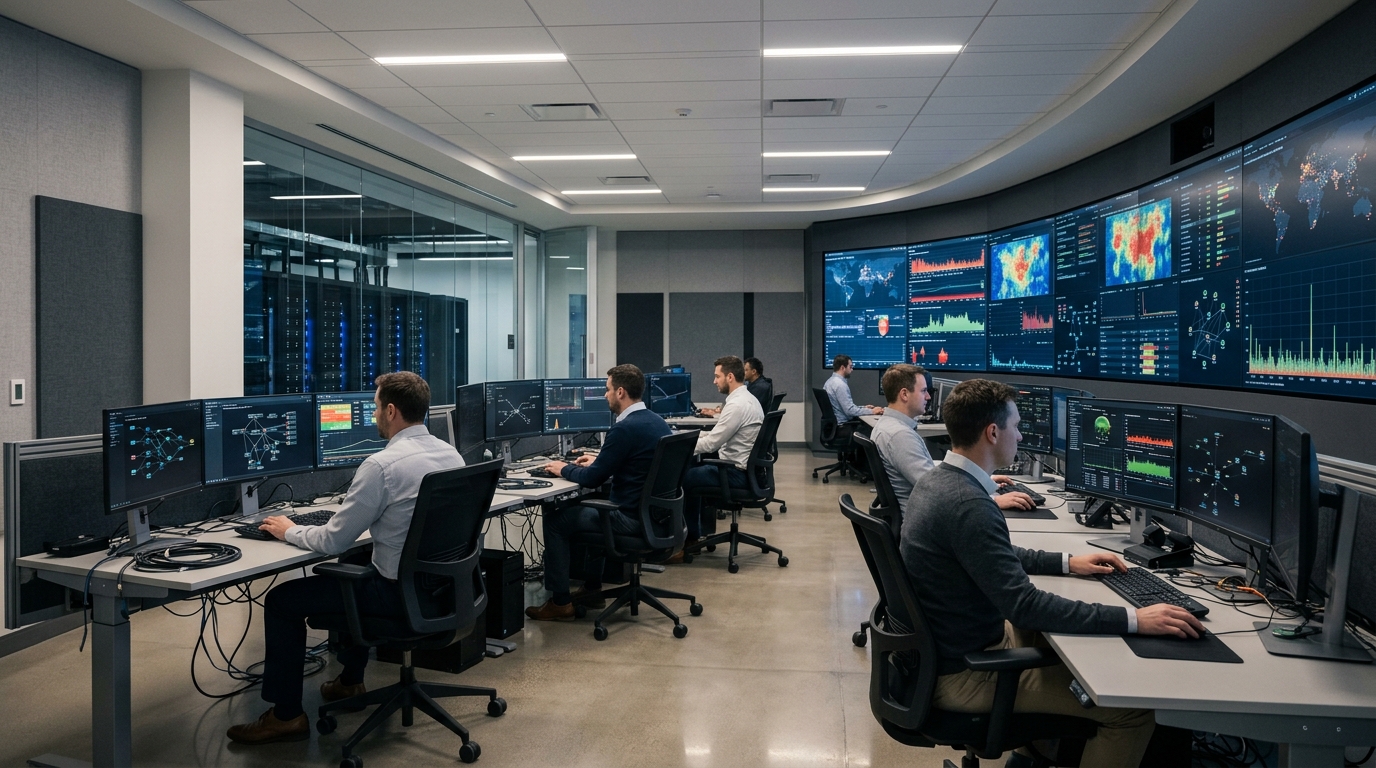
Enterprise data center network operations center with telemetry monitoring workstations
NETWORK OPERATIONS CENTER & TELEMETRY MONITORING (ILLUSTRATIVE)NOC OPERATIONS
01 //

Standardized Reporting Streams

Different stakeholders require different views of digital infrastructure: facility engineers need minute-by-minute mechanical efficiency curves, IT leadership requires SLA and uptime verifications, and corporate boards demand auditable carbon accounting ledgers.

GreenNext provides automated reporting pipelines that transform raw operational time-series data into standardized, role-specific publications:

EXECUTIVE & BOARD

Executive Infrastructure Summaries

High-level dashboards tracking overall capacity utilization, electricity expenditure, compute efficiency, and progress toward corporate sustainability targets.

ENGINEERING & OPERATIONS

Detailed Operational Reviews

Weekly technical reports detailing MTBF/MTTR metrics, incident root causes, PUE/WUE trend variances, and sub-circuit phase balance distributions.

COMPLIANCE & AUDIT

Regulatory ESG Compliance Ledgers

Immutable data extracts formatted for statutory non-financial disclosures, including SEBI BRSR Core, EU CSRD, and GHG Protocol Scope 1, 2, and 3 reporting.

TENANT & CHARGEBACK

Tenant Resource & SLA Invoices

Transparent consumption reports breaking down exact kilowatt-hours, peak kW demand, and cooling resource allocation per hosted tenant or department.

02 //

Automated Publication & Data Integrity

By automating data extraction and report generation, GreenNext eliminates human error, data manipulation, and manual spreadsheet assembly. Every published report maintains cryptographic lineage back to the originating calibrated sensor records.

Next Step in Lifecycle

Continue Exploring Automation

Explore Regional Infrastructure →
Start a Conversation

Build the Next Generation of Digital Infrastructure

If you are involved in infrastructure planning, data center operations, AI workload management, or regional digital development across South India, we want to understand your requirements.

KPI 02 · FACILITY & SLA METRIC

Data Centre Availability & Uptime Calculator

Calculates empirical availability over a defined observation window and quantifies allowed downtime budgets against operational SLA thresholds.

SLA Window Tracking
Governing EquationAvailability (%) = (Total Time − Qualifying Downtime) ÷ Total Time × 100
Alternative Form: Availability = MTBF ÷ (MTBF + MTTR)
0.75 hours
Empirical Availability99.99% (Four Nines / Tier IV Target)
99.9914%
Total Measured Window:8,760 Hours
Total Delivered Uptime:8,759.25 Hours
Total Outage Duration:45 Minutes (0.75h)
Operational Context: An availability of 99.991% satisfies contracts requiring up to 99.99% SLA uptime over this period.
Tier Architecture vs Measured Uptime

Uptime Institute Tier certifications (Tier I through IV) certify design topology and concurrent maintainability. A Tier III design does not automatically guarantee 99.982% availability without disciplined operational execution (SOPs/MOPs) and qualified 24/7 critical facility engineering.

Industry Benchmark: The "Nines of Availability" Budget Table

Availability %ClassificationAllowed Annual Downtime (8,760h)Allowed Monthly Downtime (730h)
99.0%Two Nines87.6 hours / year7.3 hours / month
99.9%Three Nines8.76 hours / year43.8 minutes / month
99.95%Three Nines Five4.38 hours / year21.9 minutes / month
99.982%Tier III Target1.58 hours (94.6 mins) / year7.9 minutes / month
99.99%Four Nines (Tier IV Target)52.6 minutes / year4.38 minutes / month
99.999%Five Nines (Carrier Grade)5.26 minutes / year26.3 seconds / month